Note
Access to this page requires authorization. You can try signing in or changing directories.
Access to this page requires authorization. You can try changing directories.
Note
This article applies to Azure Azure Cloud Services (extended support). On March 31, 2027, the Cloud Services (Extended Support) deployment model will be retired. As a result, the supporting Cloud Services tooling will not be available in the latest Visual Studio after this date. Cloud Services (Extended Support) tooling will continue to work in Visual Studio 2022 with general maintenance occurring until March 31, 2027. We recommend starting your migration planning now to ensure a smooth transition. See the official announcement for more information, including detailed guidance on migrating your apps to modern Azure services.
Azure Cloud Services relies on connection strings for authentication in some cases, such as for storage accounts. Connection strings and passwords are inherently insecure due to the risk of unintended exposure or compromise. Microsoft recommends using managed identities for authentication, and services such as Service Fabric managed clusters.
When you need to troubleshoot an Azure Cloud Services (extended support) service or virtual machine, you can use Visual Studio to more easily set up Azure Diagnostics. Diagnostics captures system data and logging data on the virtual machines and virtual machine instances that run your cloud service. Diagnostics data is transferred to a storage account that you choose. For more information about diagnostics logging in Azure, see Enable diagnostics logging for Web Apps in Azure App Service.
In this article, we show you how to use Visual Studio to turn on and set up Azure Diagnostics. Learn how to set up Diagnostics on Azure Virtual Machines, how to select the types of diagnostics information to collect, and how to view the information after it's collected.
To set up Azure Diagnostics, change diagnostics settings in the Diagnostics Configuration dialog box in Visual Studio. The settings are saved in a file called diagnostics.wadcfgx. You also can directly modify the configuration file. If you manually update the file, the configuration changes take effect the next time you deploy the cloud service to Azure or run the service in the emulator.
Warning
In Visual Studio 2022, the deprecated Azure Storage Emulator was replaced with the Azurite emulator when debugging your Cloud Service projects. This Azurite emulator does not work with the Azure Diagnostics plug-in, which provides support for Azure Diagnostics when running and testing locally. If you need the plug-in for local running and testing scenarios, you can either update the connection string in the local service configuration (.cscfg) to an Azure Storage account (see Manage connection strings for storage accounts), or download the previous Azure Storage emulator.
In the Visual Studio 17.10 release, the local Azure Diagnostics plug-in is being deprecated and disabled by default with the option to enable in that release. The plug-in was removed in Visual Studio 17.11. This plug-in was only used with the local Azure Compute emulator and disabling doesn't impact deployed Cloud Services that use the Azure Diagnostics extension in Azure. To enable the diagnostics plug-in in Visual Studio 17.10, add the following property setting to any PropertyGroup in your project file: <EnableEmulatorDiagnosticsPlugin>True</EnableEmulatorDiagnosticsPlugin>.
How Visual Studio determines the diagnostics storage account
- If a diagnostics connection string is specified in the
.cscfgfile, Visual Studio uses it to set up the diagnostics extension during publishing and when it generates the public configuration XML files during packaging. - If a diagnostics connection string is not specified in the
.cscfgfile, Visual Studio falls back to using the storage account that's specified in the.wadcfgxfile to set up the diagnostics extension for publishing and for generating the public configuration XML files during packaging. - The diagnostics connection string in the
.cscfgfile takes precedence over the storage account in the.wadcfgxfile. If a diagnostics connection string is specified in the.cscfgfile, Visual Studio uses that connection string and ignores the storage account in.wadcfgx.
What does the "Update development storage connection strings..." checkbox do?
The Update development storage connection strings for Diagnostics and Caching with Microsoft Azure storage account credentials when publishing to Microsoft Azure checkbox is a convenient way to update any development storage account connection strings with the Azure Storage account that you specify during publishing. When you publish the project to Azure, Visual Studio automatically updates the diagnostics connection string with the storage account that you specified in the Publish wizard. However, if a real storage account was specified as the diagnostics connection string, that account is used instead.
Set up diagnostics data sources
After you enable diagnostics data collection, you can choose exactly what data sources you want to collect, and what information is collected. The next sections describe the tabs in the Diagnostics configuration dialog box and what each configuration option means.
Application logs
Application logs have diagnostics information that's produced by a web application. If you want to capture application logs, select the Enable transfer of Application Logs checkbox. To increase or decrease the interval between the transfer of application logs to your storage account, change the Transfer Period (min) value. You also can change the amount of information captured in the log by setting the Log level value. For example, select Verbose to get more information, or select Critical to capture only critical errors. If you have a specific diagnostics provider that emits application logs, you can capture the logs by adding the provider's globally unique identifier (GUID) in the Provider GUID box.

For more information about application logs, see Enable diagnostics logging for Web Apps in Azure App Service.
Windows event logs
To capture Windows event logs, select the Enable transfer of Windows Event Logs checkbox. To increase or decrease the interval between the transfer of event logs to your storage account, change the Transfer Period (min) value. Select the checkboxes for the types of events that you want to track.
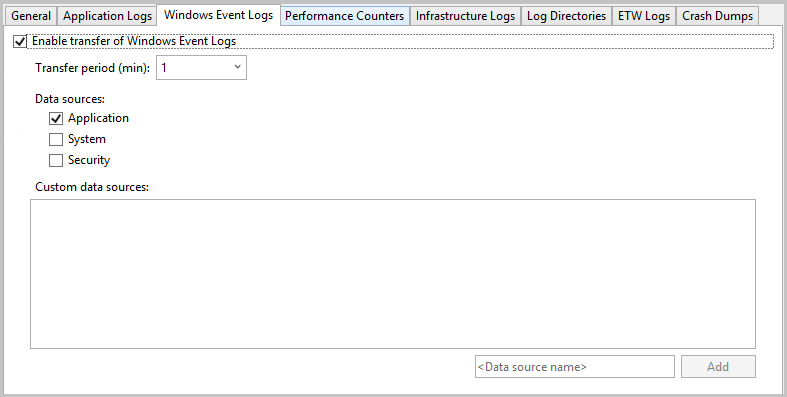
If you want to specify a custom data source, enter it in the <Data source name> text box, and then select Add. The data source is added to the diagnostics.cfcfg file.
Performance counters
Performance counter information can help you locate system bottlenecks and fine-tune system and application performance. For more information, see Create and use performance counters in an Azure application. To capture performance counters, select the Enable transfer of Performance Counters checkbox. To increase or decrease the interval between the transfer of event logs to your storage account, change the Transfer Period (min) value. Select the checkboxes for the performance counters that you want to track.

To track a performance counter that isn't listed, enter the performance counter by using the suggested syntax. and then select Add. The operating system on the virtual machine determines which performance counters you can track. For more information about syntax, see Specify a counter path.
Infrastructure logs
Infrastructure logs have information about the Azure diagnostic infrastructure, the RemoteAccess module, and the RemoteForwarder module. To collect information about infrastructure logs, select the Enable transfer of Infrastructure Logs checkbox. To increase or decrease the interval between the transfer of infrastructure logs to your storage account, change the Transfer Period (min) value.

For more information, see Collect logging data by using Azure Diagnostics.
Log directories
Log directories have data collected from log directories for Internet Information Services (IIS) requests, failed requests, or folders that you choose. To capture log directories, select the Enable transfer of Log Directories checkbox. To increase or decrease the interval between the transfer of logs to your storage account, change the Transfer Period (min) value.
Select the checkboxes of the logs that you want to collect, such as IIS Logs and Failed Request logs. Default storage container names are provided, but you can change the names.
You can capture logs from any folder. Specify the path in the Log from Absolute Directory section, and then select Add Directory. The logs are captured in the specified containers.

ETW logs
If you use Event Tracing for Windows (ETW) (ETW) and want to capture ETW logs, select the Enable transfer of ETW Logs checkbox. To increase or decrease the interval between the transfer of logs to your storage account, change the Transfer Period (min) value.
The events are captured from event sources and event manifests that you specify. To specify an event source, in the Event Sources section, enter a name and then select Add Event Source. Similarly, you can specify an event manifest in the Event Manifests section, and then select Add Event Manifest.

The ETW framework is supported in ASP.NET through classes in the System.Diagnostics.aspx namespace. The Microsoft.WindowsAzure.Diagnostics namespace, which inherits from and extends standard System.Diagnostics.aspx classes, enables the use of System.Diagnostics.aspx as a logging framework in the Azure environment. For more information, see Take control of logging and tracing in Microsoft Azure and Enable diagnostics in Azure Cloud Services (extended support) and virtual machines.
Crash dumps
To capture information about when a role instance crashes, select the Enable transfer of Crash Dumps checkbox. (Because ASP.NET handles most exceptions, this is generally useful only for worker roles.) To increase or decrease the percentage of storage space devoted to the crash dumps, change the Directory Quota (%) value. You can change the storage container where the crash dumps are stored, and select whether you want to capture a Full or Mini dump.
The processes currently being tracked are listed in the next screenshot. Select the checkboxes for the processes that you want to capture. To add another process to the list, enter the process name and then select Add Process.

For more information, see Take control of logging and tracing in Microsoft Azure.
Troubleshoot Azure Cloud Services (extended support) issues
If you experience problems with your cloud service projects, like a role that gets stuck in a "busy" status, repeatedly recycles, or throws an internal server error, there are tools and techniques that you can use to diagnose and fix the issue. For specific examples of common problems and solutions, and for an overview of the concepts and tools that you can use to diagnose and fix these errors, see Azure platform as a service (PaaS) compute diagnostics data.
Q & A
What is the buffer size, and how large should it be?
On each virtual machine instance, quotas limit how much diagnostics data can be stored on the local file system. In addition, you specify a buffer size for each type of diagnostics data that's available. This buffer size acts like an individual quota for that type of data. To determine the overall quota and the amount of memory that remains, see the bottom of the dialog box for the diagnostics data type. If you specify larger buffers or more types of data, you'll approach the overall quota. You can change the overall quota by modifying the diagnostics.wadcfgx configuration file. The diagnostics data is stored on the same file system as your application's data. If your application uses a large amount of disk space, you shouldn't increase the overall diagnostics quota.
What is the transfer period, and how long should it be?
The transfer period is the amount of time that elapses between data captures. After each transfer period, data is moved from the local file system on a virtual machine to tables in your storage account. If the amount of data that's collected exceeds the quota before the end of a transfer period, older data is discarded. If you are losing data because your data exceeds the buffer size or the overall quota, you might want to decrease the transfer period.
What time zone are the time stamps in?
Time stamps are in the local time zone of the datacenter that hosts your cloud service. The following three time stamp columns in the log tables are used:
- PreciseTimeStamp: The ETW timestamp of the event. That is, the time the event is logged from the client.
- TIMESTAMP: The value for PreciseTimeStamp rounded down to the upload frequency boundary. For example, if your upload frequency is 5 minutes and the event time 00:17:12, TIMESTAMP is 00:15:00.
- Timestamp: The time stamp at which the entity was created in the Azure table.
How do I manage costs when collecting diagnostic information?
The default settings (Log level set to Error, and Transfer period set to 1 minute) are designed to minimize costs. Your compute costs increase when you collect more diagnostics data or if you decrease the transfer period. Don't collect more data than you need, and don't forget to disable data collection when you no longer need it. You can always enable it again, even at run time, as described earlier in this article.
How do I collect failed-request logs from IIS?
By default, IIS doesn't collect failed-request logs. You can set up IIS to collect failed-request logs by editing the web.config file for your web role.
I'm not getting trace information from RoleEntryPoint methods like OnStart. What's wrong?
The methods of RoleEntryPoint are called in the context of WAIISHost.exe, not in IIS. The configuration information in web.config that normally enables tracing doesn't apply. To resolve this issue, add a .config file to your web role project, and name the file to match the output assembly that contains the RoleEntryPoint code. In the default web role project, the name of the .config file should be WAIISHost.exe.config. Add the following lines to this file:
<system.diagnostics>
  <trace>
      <listeners>
          <add name "AzureDiagnostics" type="Microsoft.WindowsAzure.Diagnostics.DiagnosticMonitorTraceListener">
              <filter type="" />
          </add>
      </listeners>
  </trace>
</system.diagnostics>
In the Properties window, set the Copy to Output Directory property to Copy always.
Related content
To learn more about diagnostics logging in Azure, see Enable diagnostics in Azure Cloud Services (extended support) and virtual machines and Enable diagnostics logging for Web Apps in Azure App Service.