Note
Access to this page requires authorization. You can try signing in or changing directories.
Access to this page requires authorization. You can try changing directories.
Visual Studio gives you different options for debugging Azure Cloud Services (extended support) and virtual machines.
Prerequisites
- Visual Studio (see [Visual Studio downloads] (https://aka.ms/vs/download/?cid=learn-onpage-download-cta)) with the Azure development workload installed, and the Individual Component .NET Framework project and item templates installed. See Modify Visual Studio.
- An Azure account. If you don't have an Azure account, activate your Azure benefits for Visual Studio subscribers or sign up for a free trial.
Debug your cloud service on your local computer
You can save time and money by using the Azure Compute Emulator to debug your cloud service on a local machine. By debugging a service locally before you deploy it, you can improve reliability and performance without paying for compute time. However, some errors might occur only when you run a cloud service in Azure itself. You can debug these errors if you enable remote debugging when you publish your service and then attach the debugger to a role instance.
The emulator simulates the Azure Compute service and runs in your local environment so that you can test and debug your cloud service before you deploy it. The emulator handles the lifecycle of your role instances and provides access to simulated resources, such as local storage. When you debug or run your service from Visual Studio, it automatically starts the emulator as a background application and then deploys your service to the emulator. You can use the emulator to view your service when it runs in the local environment. You can run the full version or the express version of the emulator. See Using Emulator Express to Run and Debug a Cloud Service Locally.
To debug your cloud service on your local computer
On the menu bar, select Debug > Start Debugging to run your Azure Cloud Services (extended support) project. As an alternative, you can press F5. You'll see a message that the Compute Emulator is starting. When the emulator starts, the system tray icon confirms it.

Display the user interface for the compute emulator by opening the shortcut menu for the Azure icon in the notification area, and then select Show Compute Emulator UI.
The left pane of the UI shows the services that are currently deployed to the compute emulator and the role instances that each service is running. You can choose the service or roles to display lifecycle, logging, and diagnostic information in the right pane. If you put the focus in the top margin of an included window, it expands to fill the right pane.
Step through the application by choosing commands on the Debug menu and setting breakpoints in your code. As you step through the application in the debugger, the panes are updated with the current status of the application. When you stop debugging, the application deployment is deleted. If your application includes a web role and you've set the Startup action property to start the web browser, Visual Studio starts your web application in the browser. If you change the number of instances of a role in the service configuration, you must stop your cloud service and then restart debugging so that you can debug these new instances of the role.
Note
When you stop running or debugging your service, the local compute emulator and storage emulator aren't stopped. You must stop them explicitly from the notification area.
Debug a cloud service in Azure
If you enable remote debugging for a cloud service using the procedure in this section, it doesn't exhibit degraded performance or incur additional charges. Don't use remote debugging on a production service, because clients who use the service might be adversely affected.
To enable remote debugging for a cloud service (extended support)
Add an Endpoint to the ServiceDefinition.csdef for the default msvsmon port. For Visual Studio 2022, that's 4026; for Visual Studio 2019, it's 4024.
<Endpoints>
   <InputEndpoint name="RemoteDebug" protocol="tcp" port="4026" localPort="4026" />
</Endpoints>
Note
Other versions of Visual Studio have different ports Remote Debugger Port Assignments.
If you are targeting .NET 4.8, be sure to open the ServiceConfiguration.Cloud.cscfg file and check the value of the
osFamilyattribute on theServiceConfigurationelement when publishing Cloud Services (extended support). For a .NET 4.8 project, useosFamily="7".Open the shortcut menu for the Azure project, and then select Publish.
Select the Staging environment and the Debug configuration.
This is only a guideline. You can opt to run your test environments in a Production environment. However, you may adversely affect users if you enable remote debugging on the Production environment. You can choose the Release configuration, but the Debug configuration makes debugging easier.

Follow the usual steps described at Cloud Services (extended support), but select the Enable Remote Desktop for all roles checkbox.
You'll be asked to create a username and password for the remote desktop user, which you'll need later to sign in to that virtual machine.
Advance to the next screen, review your settings, and when ready, click Publish and wait for the deployment to finish.
Sign in to Azure portal and navigate to the Cloud Service (extended support) that you want to debug.
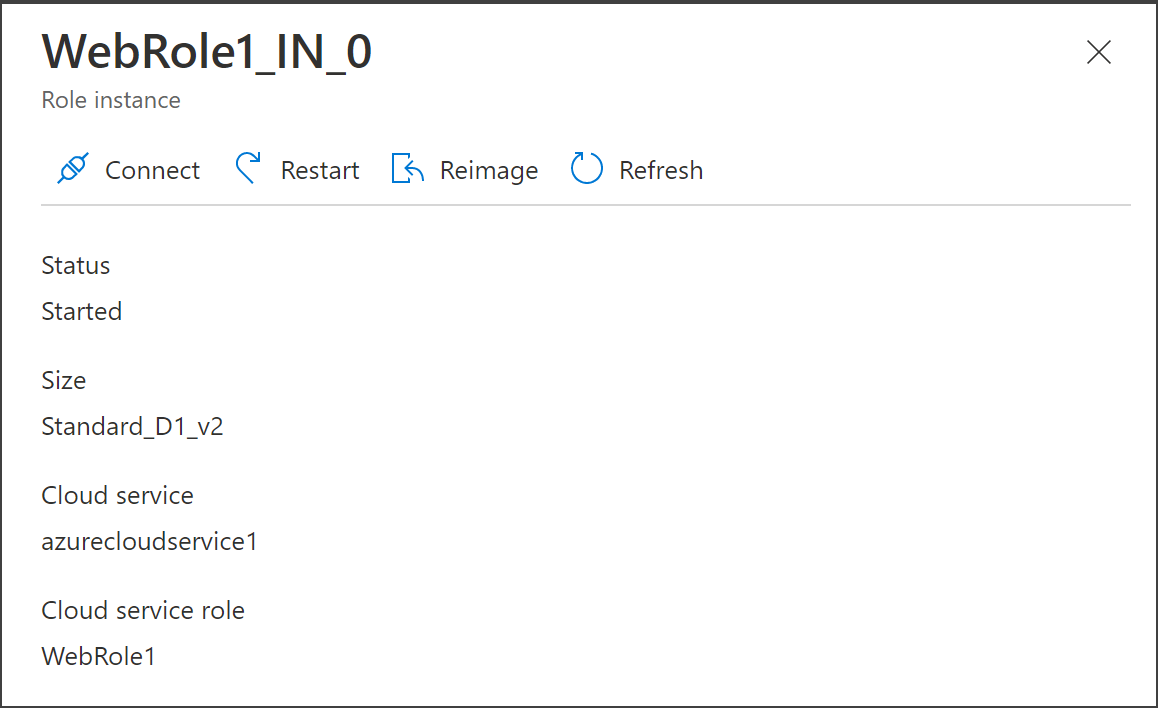
Choose Roles and Instances in the left hand pane, then choose the role that you are interested in debugging remotely.
Click Connect in the Role Instance popout on the right and choose the Connect button to download a remote desktop file that will let you sign in to the virtual machine. Sign in using the credentials you created when you enabled remote desktop in a previous step.
On the Remote Azure virtual machine, install the Visual Studio 2022 Remote tools as described at Remote debugging.
From the desktop on the virtual machine, execute the command msvsmon.exe in the Visual Studio installation folder under
Common7\IDE\Remote Debugger\x64. Be sure to run as Administrator.Accept prompts to allow access through the firewall. You should see a message indicating that msvsmon.exe has started listening for connections.

In the Azure portal, open the resource group and get the public IP Address for the Cloud Service (extended support).


To attach the debugger to a cloud service (extended support) in Azure
Note
Whenever possible, you should debug with the Debug configuration chosen in the Publish process, but if you are debugging a Release configuration, then in Visual Studio, use Ctrl+Q to search for "Just My Code" and uncheck Enable Just My Code in Tools > Options > Debugger > General. Release builds are optimized and thus are not considered "My code."
Choose Debug > Attach to Process (or press Ctrl+Alt+P).
Keep connection type at Default.
Enter the connection target, using your IP address and port:
{ipaddress}:4026.Set Attach To to Automatic.
Sign in using the same credentials as remote desktop user.
Select Show process for all users. If you're debugging a worker role, attach to WaWorkerHost.exe; if you're debugging a web role, attach to the w3wp.exe process; for a Web API role, it's WaIISHost.exe.
Set breakpoints (navigate to the line, and press F9), access the site's public URL, and reproduce the scenario to debug.
Debugging Azure App Service
You can debug programs that run in Azure App Service by using the Attach to Process dialog in Visual Studio.
Note
This is only available for Azure App Service starting in Visual Studio 2022 17.1.
To debug a Windows Azure App Service
Under Debug, select Attach to Process.
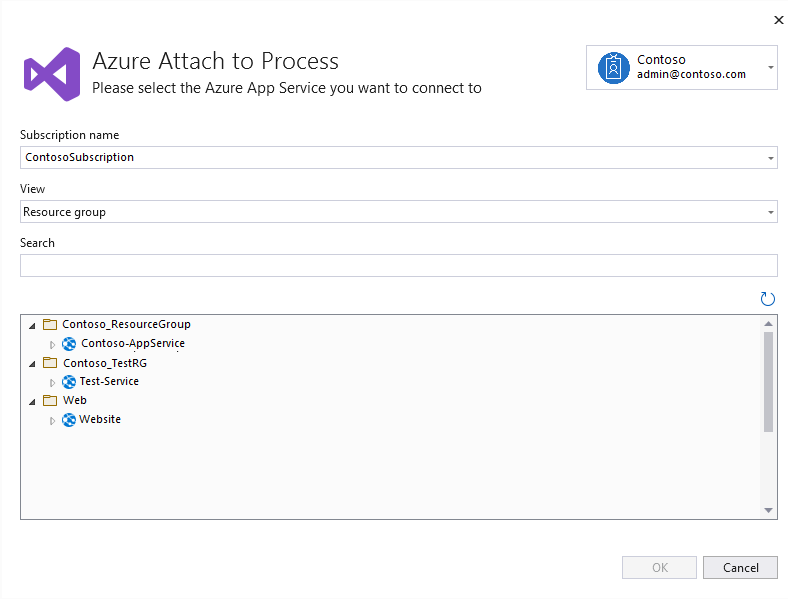
Change Connection type to Microsoft Azure App Services, then select Find...
In the dialog box that opens, select the Subscription name.
Note
You need to be signed in to a Microsoft Account with access to the subscription that contains your Azure App Service.
Filter the view by either Resource Group or Resource Type, or search by name.
Next, select the App Service you want to debug then select Ok.
This enables remote debugging on your App Service and shows you a list of available processes to attach to.
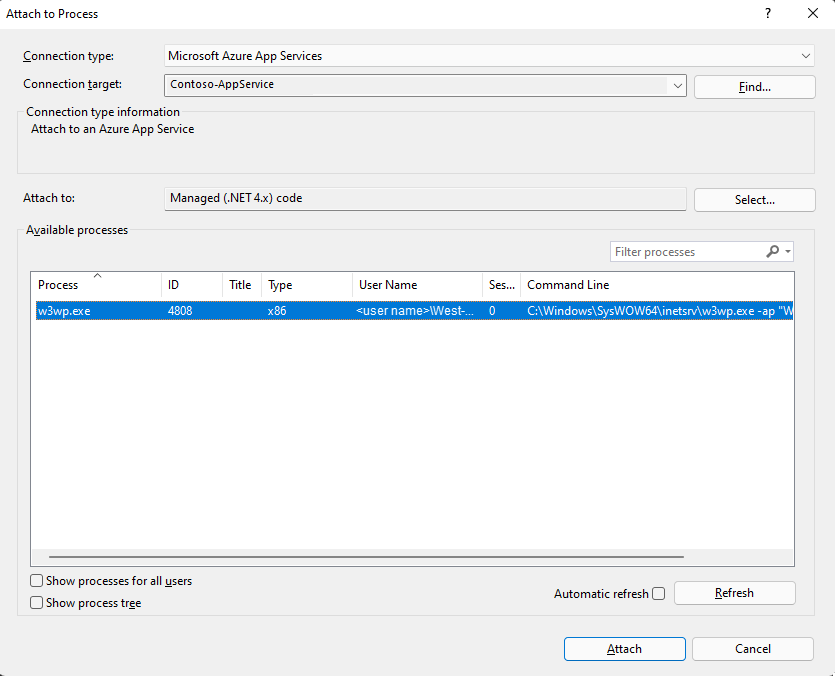
Select the process you want to attach to and then choose Attach to start debugging.
Related content
Use Azure Diagnostics to log detailed information from code running within roles, in Azure. See Collecting logging data by using Azure Diagnostics.
For other remote debugging scenarios, see Remote debugging.